Are you trying to make sense of shifting housing headlines and what they mean for your next move in Ross Township? You want clear numbers, plain-English guidance, and a plan that fits your timeline. In this guide, you’ll see what prices, competition, and inventory look like right now, why different sources sometimes disagree, and how to turn the data into smart buyer or seller strategy. Let’s dive in.
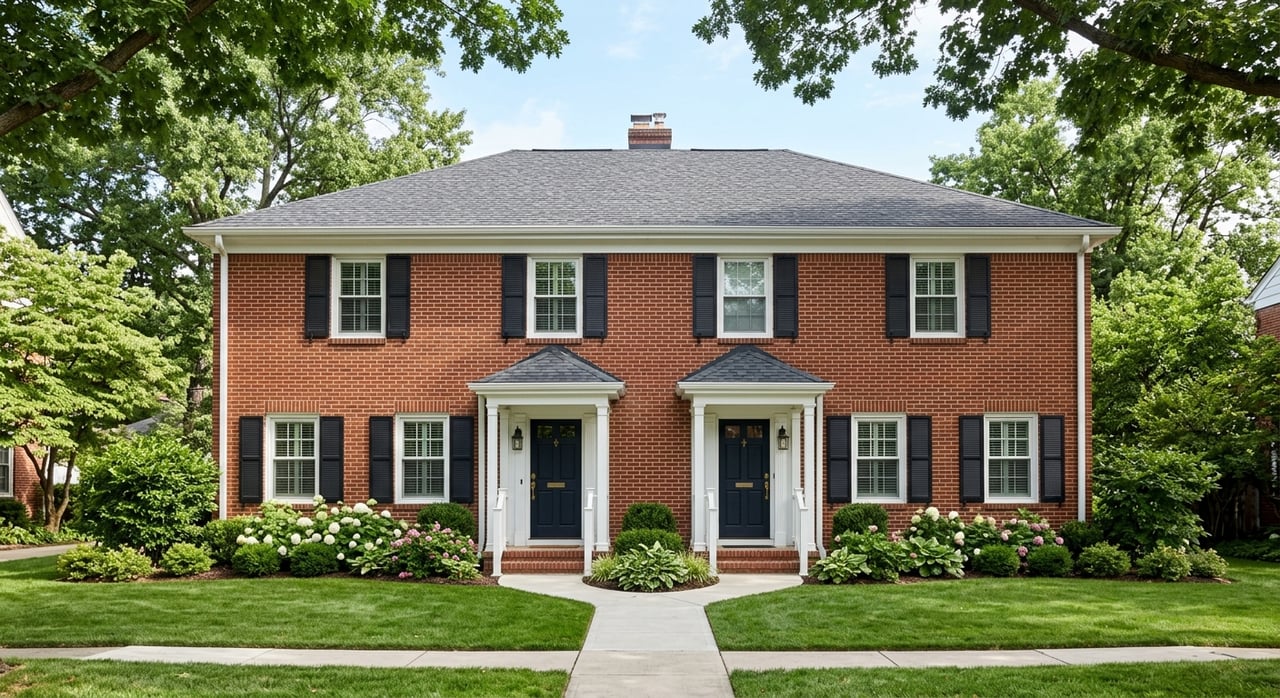
Ross Township at a glance
Ross Township sits in a mid-to-high $200Ks price band based on recent snapshots. Realtor.com reported a median listing price of $277,497 in December 2025. Rocket Homes reported a 12-month median sold price of $289,500 through June 2025. These reflect different windows, yet both point to a similar price range.
On pricing power, Realtor.com showed an average sale-to-list ratio near 100% in December 2025. Rocket’s June 2025 snapshot found about 53% of sales closed over asking during that month. Together, that suggests sellers often achieve asking price on average, with spring and early summer bringing bursts of multiple-offer activity.
Sales pace varies by season and source. Rocket reported an average time to sell of about 24 days in June 2025. Realtor.com showed a median days on market of 75 days in December 2025. These are different measures and different months, which explains most of the gap and highlights how much faster the market can feel in peak season.
Inventory moves with the calendar too. Rocket counted 125 active homes for sale in June 2025 with 36 sold or pending that month, while Realtor.com showed 88 active listings in December 2025. The takeaway is simple. Expect more options and quicker movement in late spring and early summer, then a slower winter with fewer choices.
Why sources show different numbers
You will see metrics labeled differently. A 12-month median sold price blends a full year of closings and smooths out monthly swings. A “current median listing price” captures the latest asking prices and reacts faster to shifts.
Days on market is also defined in several ways. Some sources show average listing age. Others show median days to pending or days to close. When you compare June to December, you are also comparing peak season to off-season, which can double the posted DOM.
Small monthly sample sizes can make percent changes look large. That is why it helps to pair a rolling 12-month median with a current-month snapshot, so you get both trend and timing.
Inventory and months of supply
Months of supply helps you understand who has the upper hand. It is calculated as active listings divided by monthly sales.
- Example using Rocket’s June 2025 figures: 125 active listings and 36 sales equals about 3.5 months of supply. Markets under roughly 4 months tend to lean toward sellers, while 4 to 6 months reads as more balanced.
- If you use 88 active listings from Realtor.com’s December 2025 snapshot with the same 36 monthly sales, you get about 2.4 months of supply. That points to a stronger seller-leaning signal.
The difference is timing. Inventory and sales volume flex across the year, so always ask for a current read before you set pricing or write an offer.
Local drivers to watch
- Mortgage rates. The 30-year fixed averaged about 6.09% in the Freddie Mac survey for the week of February 12, 2026. Lower rates than a year earlier can support buyer activity and improve affordability. See the weekly trend on the Freddie Mac mortgage rate page.
- Retail and entertainment. Redevelopment along McKnight Road and the Ross Park Mall area continues to add amenity value. A recent example is a planned three-story entertainment complex at Ross Park Mall, as covered by NEXTpittsburgh. Amenity upgrades can increase local demand over time.
- Ownership base. According to Census QuickFacts, about 72.1% of Ross Township homes are owner-occupied, and the median value of owner-occupied units is $268,900. These are useful baselines when evaluating long-term affordability and demand. Review the data on Census QuickFacts for Ross Township.
What the numbers mean for sellers
In peak season, your pricing and presentation matter most in the first week on market. Multiple-offer windows can open quickly, and early momentum tends to set the tone.
- Price to the market. With sale-to-list near 100% on average and a strong share of over-ask sales in June, aim to list competitively rather than “testing high.” Ask your agent for 30, 60, and 90-day comps and the current list-to-sale ratios for your home type.
- Time your launch. Spring and early summer often produce faster sales and more over-ask outcomes. If your move is flexible, plan for that window. If not, lean into preparation, pricing precision, and marketing reach.
- Prepare for day one. Handle obvious repairs, declutter, and invest in strong photography. When buyers move quickly, first impressions drive showings and offers.
- Clarify expectations. Ask for your agent’s pricing rationale, expected days on market at your list price, and a full marketing plan that covers online exposure, open houses, and agent-to-agent outreach.
What the numbers mean for buyers
In competitive weeks, speed and clarity win. In slower months, patience and negotiation can help you secure better terms.
- Get fully ready. Secure pre-approval and review recent list-to-sale ratios and the percent of over-ask sales in your target micro-markets. If over-ask is common, plan your strategy, including escalation terms and deposit strength.
- Mind appraisal risk. If prices press above list, prepare for appraisal conversations. Discuss financing structure and potential appraisal gap planning with your lender and agent.
- Watch DOM by month. When days on market run short, move decisively on well-priced homes. When DOM stretches in winter, you often have more room to negotiate price and credits.
- Focus your search. Zero in on home types, condition ranges, and locations that fit your budget. That way you can react fast when the right home appears.
Pricing, value, and negotiation tips
- Use both trend and snapshot. Compare a 12-month median sold price to the current median listing price. This tells you whether asking prices are running ahead of recent closings or not.
- Pair price with pace. If price per square foot is rising but DOM is also rising, that can signal overpricing. If price per square foot is rising while DOM is steady or falling, demand may be strengthening.
- Monitor months of supply. Under 4 months often favors sellers. Four to 6 months reads more balanced. Over 6 months often shifts leverage toward buyers. Ask for a current calculation that matches your specific price range and property type.
How to use this data in your move
Here is a simple, data-first process to guide your decisions.
- Define your 60-day window. Whether you plan to list or to buy, narrow your focus to the most recent 60 days of comparable activity.
- Pull tight comps. Match location, size, condition, and lot features. Note list-to-sale ratios and days on market for each comparable.
- Track live inventory. Count new listings, pending sales, and price reductions weekly. This shows whether momentum is building or cooling.
- Decide on strategy. If the data shows high over-ask rates and short DOM, plan for speed and stronger terms. If DOM is longer and months of supply is rising, negotiate more on price and concessions.
Ross Township in county context
Ross Township often sits above the county’s median price. Realtor.com’s December 2025 snapshot for Allegheny County showed a median price near $249,900. That gap reflects the amenity set and established neighborhoods you find in Ross Township, along with convenient retail corridors and commuter access.
The bottom line
- Prices sit in the mid-to-high $200Ks based on recent snapshots.
- Competition spikes in late spring and early summer.
- Inventory and pace change with the season, so verify the most recent 30 to 60 days before you set price or write an offer.
If you want a data-backed plan tailored to your timeline and budget, connect with a local advisor who analyzes both the numbers and the street-level nuance. If you are ready to talk strategy or want a pricing and prep plan for your home, reach out to Nate Nieland to get started.
FAQs
What is the current price range in Ross Township?
- Recent vendor snapshots place the market in the mid-to-high $200Ks, with a December 2025 median listing price of $277,497 and a 12-month median sold price of $289,500 through June 2025.
How competitive is Ross Township right now?
- On average, homes sell near asking price, but spring and early summer often bring multiple offers, with about 53% of June 2025 sales closing over list in one snapshot.
Why do days-on-market numbers look so different?
- Sources use different definitions and timeframes; June readings reflect peak activity with faster sales, while December snapshots capture slower winter conditions.
What is months of supply, and why should I care?
- Months of supply equals active listings divided by monthly sales; under roughly 4 months usually favors sellers, 4 to 6 months is more balanced, and higher levels tilt toward buyers.
How do mortgage rates affect Ross Township buyers?
- When rates ease, purchasing power improves and buyer activity can increase; the Freddie Mac survey showed about 6.09% for the 30-year fixed the week of February 12, 2026.
Are local amenities influencing demand in Ross Township?
- Yes. Ongoing retail and entertainment updates near McKnight Road and Ross Park Mall add convenience and lifestyle value, which can support housing demand over time.